Premium Cultivars E-commerce Redesign
Redesigned a cannabis e-commerce platform to combat 60% SEO traffic decline, increasing conversion rate by 65% and average order value by 35% within 4 weeks of launch.
A Traffic Crisis Revealed a Deeper UX Problem
Premium Cultivars, a legal cannabis seed and THCa gummies retailer, experienced a 60% drop in organic traffic due to industry-wide SEO challenges. With traffic declining, the business needed to maximize conversion from existing visitors while rebuilding search visibility through improved UX and mobile optimization.
Through behavioral data analysis (heatmaps, GA), customer surveys (100 responses), and usability testing (6 participants), I uncovered the actual barriers to purchase. The problem wasn't traffic: it was that customers couldn't find critical product information to make purchase decisions.
"I can't find the THC percentage without scrolling forever"
"Is THCa actually legal in my state? This seems too good to be true"
"I don't understand the difference between these strains: Sativa vs Indica?"
What the data showed
- Users weren't scrolling far enough to find critical purchase information
- Mobile users (60% of traffic) experienced friction from non-optimized layouts
- Key promotional banners in "dead zones" with <5% click-through
- Product page bounce rate of 58%: information scarcity above the fold
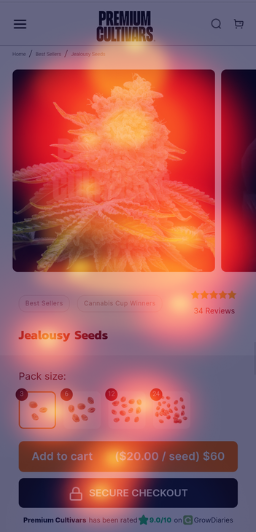
The challenge: Balance the client's desire for a premium, minimalist aesthetic with the minimum viable information customers required to confidently make a purchase decision.
Research & Discovery
I started by analyzing existing data to understand where and why users were dropping off, then validated patterns through surveys and in-person testing.
Google Analytics & Heatmaps
60% mobile traffic on a desktop-optimized experience. Product page bounce rate of 58%. Cart abandonment at 72%. Average time on product page just 12 seconds: too short to find key info. Hotjar showed users stopped scrolling at 40% page depth, with critical specs (THC %, strain type) buried below.
Customer Survey: 100 Responses
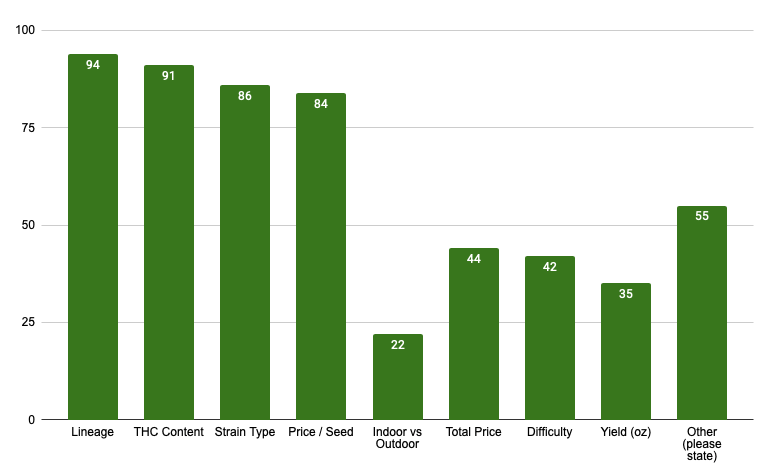
The top purchase decision factors were clear: Lineage (94%), THC content (91% said critical), strain type (86%), and price per seed/unit (84%). Additionally, 62% didn't understand that THCa is psychoactive. 54% believed it had state-level legal restrictions.
Usability Testing: 6 Participants
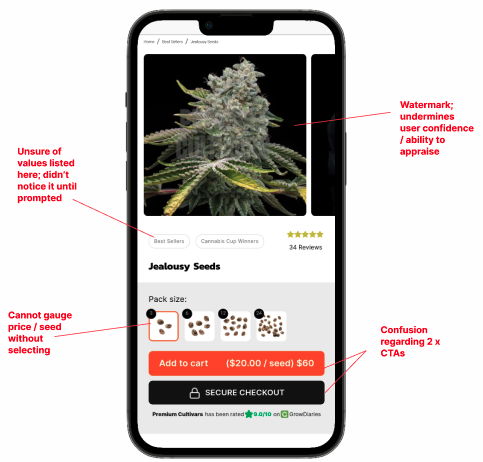
Moderated sessions revealed that participants made initial filtering decisions based purely on product photography. THC content & lineage were always the first specs they looked for: but they were 2–3 scrolls down. Price confusion occurred when variants weren't clearly displayed upfront, requiring user interaction accordingly.
"I want to see the lineage, the THC level, and the price. If I have to hunt for it, I'm going to the next site."
Strategy & Design Principles
Based on research, I established three core principles that guided every design decision:
Photography-First
Product imagery as the primary decision driver. Usability testing validated that users filter visually first: image quality signaled product quality.
Information Hierarchy
THC content, price, and strain type visible above the fold. These three data points were sufficient for 80%+ of purchase decisions.
Progressive Disclosure
Collapse secondary content (growing tips, terpene profiles) until the user needs it. Reduce cognitive load while preserving access to detail for power users.
Design & Prototyping
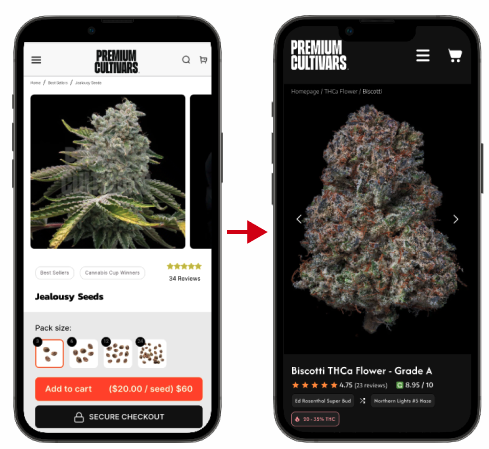
Minimalist Cards vs. Information Density
I chose photography-dominant cards with only three visible data points. Users filtered visually first, then checked specs. The trade-off was requiring stronger filter/sort functionality to narrow choices: which we solved with a robust sidebar.
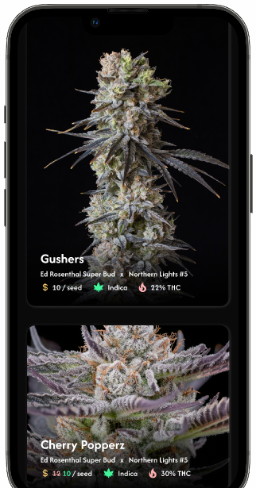
Mobile-First Layout
Designed for mobile viewport first, scaled up for desktop. 60% of traffic was mobile but the experience was desktop-shrunk. Mobile constraints forced better information hierarchy that actually improved the desktop version too.
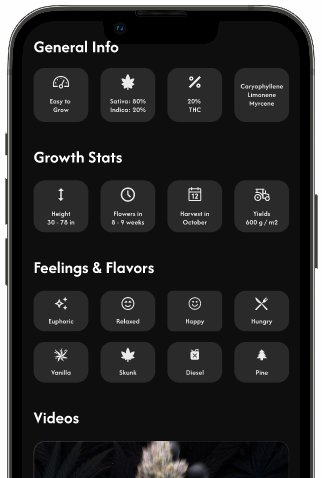
Collapsible Content Sections
SEO was hugely important to the business and had been declining slowly due to industry wide changes. As a result, specific keywords requirements were obligatory; I utilized collapsible elements to ensure our SEO performance didn't suffer as a result of the redesign whilst maintaining UI consistency and execution of vision (i.e. simple, photography based, enticing customers to interact with products).
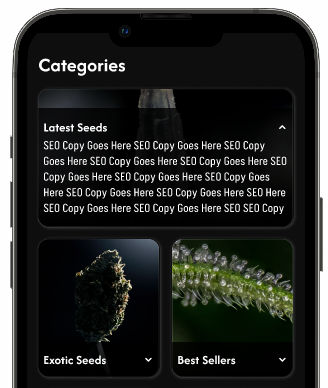
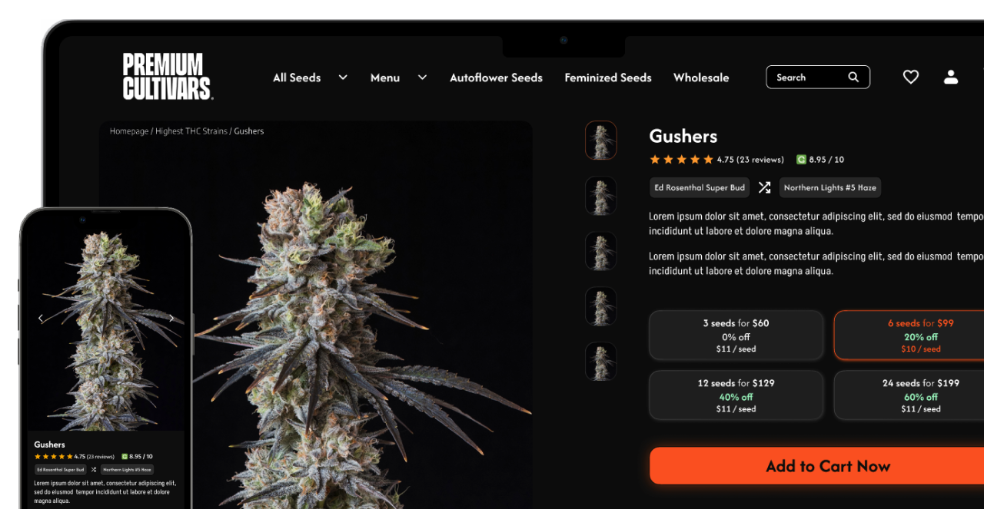
Component Library
Built a comprehensive Figma component library: 40+ reusable components, design tokens for colors/typography/spacing, responsive breakpoints, and interactive states. This enabled rapid prototyping and consistent developer handoff.
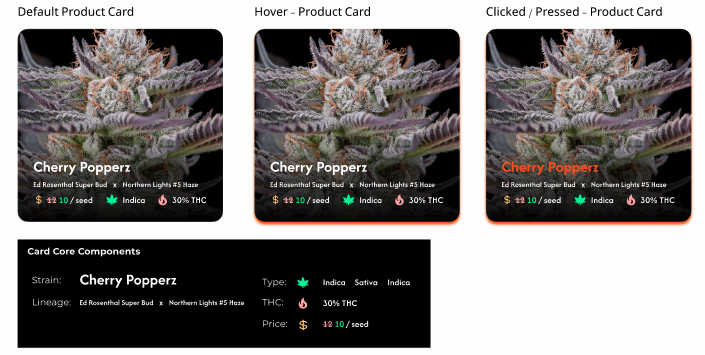
Validation & Iteration
I recruited the original 6 interview participants and gave them task-based scenarios in interactive Figma prototypes. The results validated the approach:
Task completion rate: 67% → 100%
Time to purchase decision: 2m 30s → 45 seconds
Two participants wanted strain effects visible on cards: I added an icon system (relaxing, energizing, balanced). One was confused by variant pricing: solved with "Starting at $X" language. CTA contrast was increased for better visibility.
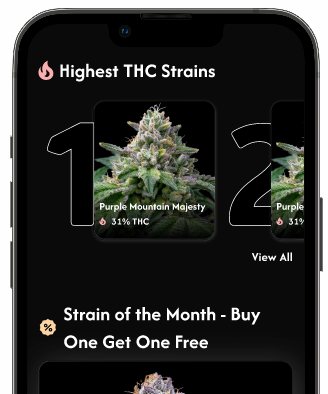
Stakeholder Collaboration
Delivered design tranches every 3 days. The owner pushed for more premium feel: increased white space and refined typography. The developer flagged platform constraints: adjusted filtration logic. Marketing needed SEO considerations: embedded schema markup requirements.
Results & Impact
Results stabilized within 4 weeks of launch:
Streamlined information hierarchy gave users the confidence to purchase faster.
Strategic upsell placement and bundle builders drove larger basket sizes.
Premium aesthetic shifted perception: 73% mentioned "high-quality" unprompted.
Mobile-first design eliminated friction for 60% of traffic previously underserved.
Brand Perception
"This brand feels premium/high-quality"
73% of respondents mentioned "premium" or "high-quality" unprompted, up from 31%.
Text
"Finally a cannabis site that doesn't look like it's from 2010. I can actually find what I need."
- Customer feedback, post-launch survey
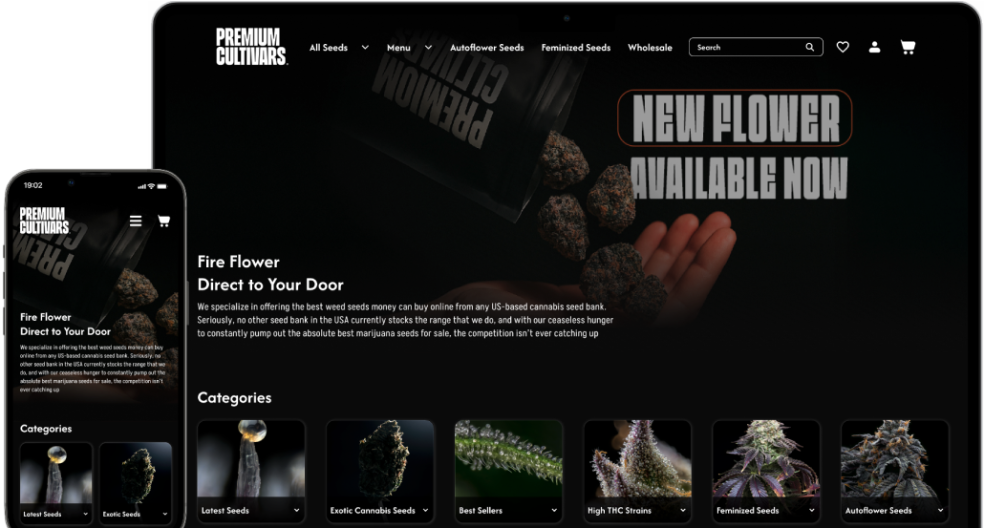
What I Learned
Minimalism works only when you surface the exact information users need, in the exact moment they need it.
Data gave me the confidence to challenge the client's "show everything" instinct.
Designing for mobile constraints forced better information hierarchy that improved desktop too.
Premium aesthetic wasn't vanity: it increased trust and willingness to purchase.
Shipping fast and learning from real users beats endless internal debate.
What I'd Do Differently
Design system investment: I'd build a full documented design system using Figma variables and design tokens for more sustainable long-term assets.
Earlier legal messaging: THCa legality confusion was a bigger conversion blocker than anticipated. I'd prioritize educational content testing earlier in the process.